

Intel Owl is an Open Source Intelligence (OSINT) solution to get threat intelligence data about a specific file or observable from a single API at scale.
Launched at the start of 2020, it has grown to include 100+ analysers (tools, external APIs) that help enrich threat intelligence data, and speed up information retrieval.
Organizations can host their own instance of Intel Owl to help in multiple scenarios, including incident response, threat analysis, security research and threat hunting. It is particularly recommended for those who need to find the ‘needle in the haystack’ as quickly as possible. You are just a single click away from getting all the information that you need, either from the GUI of the web application or from the CLI pyintelowl.
Its dashboard displays different visualizations of analysis data, including:
- Tabular views of all analysis jobs that can be filtered, sorted or searched through.
- Pie charts for visualizing analysis data based on status, observable_classification and file_mimetype. Clicking on any slice on the pie chart will filter the jobs list based on the selected classification.
- The ability to view analysis via tags.
The recent v3.0.0 release brings many new exciting features and fixes that we have been working on for the last three months (involving two Google Summer of Code projects).
The following post provides a summary of the new features and how you can use them to speed up your threat intelligence operations.
Connectors
Connectors are a new class of plugins in Intel Owl designed to support integration with other SIEM/SOAR projects specifically aimed at Threat Sharing Platforms. They run after the completion of a successful analysis, which makes them suitable for automated threat sharing, data aggregation and processing.
The v3.0.0 release brings three initial connectors that you can use today:
- MISP: Automatically creates an event on your MISP instance.
- OpenCTI: Automatically creates an observable and a linked report on your OpenCTI instance.
- YETI: Find or create an observable on YETI (Your Everyday Threat Intelligence).
We have made writing new connectors very easy (see How to add a new connector) to encourage the community to contribute to their development. You can create requests for new connectors via GitHub.
Learn more on how to enable and customize these connectors in the documentation.
Traffic Light Protocol support
Intel Owl now supports the Traffic Light Protocol (TLP) to facilitate sharing of job/analysis results in a standardized manner.

The way Intel Owl facilitates threat information sharing using TLP is that each connector has a maximum TLP value (customizable from the configuration file) associated with it that gives you control of what information is shared to external platforms.
Learn more about the definitions of different TLP indicators in the documentation.
Verification of analyser and connector configuration files
Intel Owl now verifies whether the configuration JSON files for the plugins (analysers and connectors) are valid or not by checking if the required attributes are correctly set. The application will fail to start if any of the JSON files are invalid.
It also checks for each plugin to see whether its required secrets are available or not marking them configured or unconfigured automatically. The analysers or connectors that are disabled or unconfigured will be greyed out from the selection dropdown on the GUI form (Figure 5) and will not be executed even if directly requested via the API. The reason (a helpful error message) as to why a plugin is marked unconfigured can be seen on the dropdown and the configuration tables both, as shown below:

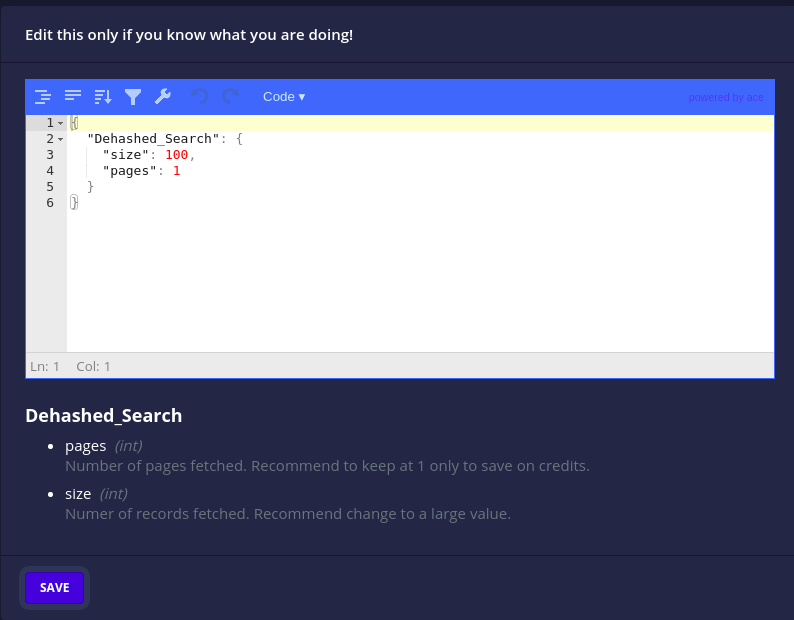
The configuration files also now hold the description and datatype of the secrets and parameter attributes (Figure 6).
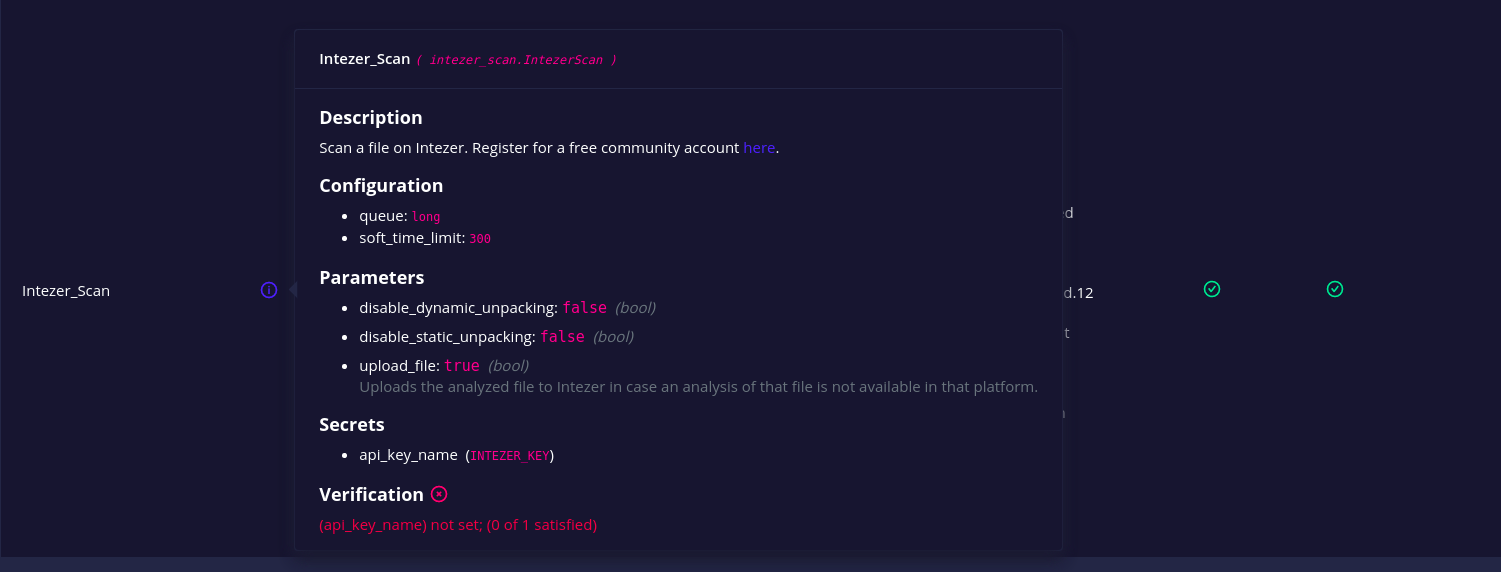
In this way, the configuration files themselves serve as self-documentation for the plugins and their parameters. This is especially useful when customizing them either from the JSON file or the GUI (Figure 7).
Analyser and connector management
Intel Owl v3.0.0 brings granular control over analysers and connectors.
- A running/pending analyser or connector can now be cancelled to stop execution and mark as killed.
- A failed/killed analyser or connector can now be retried/rerun with its original configuration.
- All docker-based analysers and connectors have a health check action to check whether their associated instances are up or not.
Learn more on how to make use of these features using pyintelowl or the API directly in the documentation.
New analysers add to existing upgrades
Finally, we have added integration with the following services:
- Spyse API: Search IP/domains/CVEs.
- OpenCTI analyser: Scan an observable on a custom OpenCTI instance.
- Intezer analysers: Scan files or query hashes.
- mwdb: Retrieve malware file analysis by hash from a repository maintained by CERT Polska MWDB.
- YETI: Scan an observable on a custom YETI instance.
- hashlookup-server: Check if an MD5 or SHA1 is available in the database of known files hosted by CIRCL.
- ClamAV Antivirus Engine: Scan files for viruses/malware/trojan.
Learn more in the v3.0.0 change log.
Update to v3.0.0 now!
If you are new to Intel Owl, we strongly suggest you try the application! It’s easy and fast. Just follow these step-by-step instructions and, in a few minutes, you can get it running on your machine.
For those who need to update to v3.0.0, we have an update guide — pay attention to the breaking changes as explained in the v3.0.0 change log.
We are continuously working on under-the-hood improvements and optimizations and are always looking for more contributors and feedback. If you don’t like something or need help, create an issue on the GitHub page and we will look into it.
If you’re looking to contribute to open source, here’s the list of beginner-friendly issues and the documentation. Remember to start the project on GitHub and to follow the official Twitter (@intel_owl) account for updates!
Adapted from original post which first appeared on The Honeynet Project.
Eshaan Bansal is a Software Developer and Threat Intelligence Engineer at Certego and Student Developer at The Honeynet Project.
The views expressed by the authors of this blog are their own and do not necessarily reflect the views of APNIC. Please note a Code of Conduct applies to this blog.