

Measurement Lab (M-Lab) is a consortium of research, industry, and public interest partners focused on fostering, collecting, and publishing open Internet performance data.
Founded in 2008, M-Lab is a fiscally sponsored project of Code for Science & Society, providing a global platform designed to enable anyone to measure their Internet service using open source tools. Today people use the M-Lab platform to run more than two million measurements per day worldwide.
Cities and municipal governments; national regulators and government agencies; academics and researchers; ISPs, network operators, and companies; civil society and advocacy organizations; and the general public are all using tests, tools, and data developed or supported by M-Lab.
For this post, we wanted to share some aggregate analyses and queries that might be of interest to network operators in the APNIC region and beyond. In doing so, we’ve focused on two data sets:
- Our Network Diagnostic Tool (NDT), which measures single TCP stream performance and latency.
- Traceroute measurements from our servers back to client IPs that have made connections to our servers.
What can M-Lab data show the APNIC community?
We’ve kept these data examples brief for the purpose of this post but if you’re interested in checking out our data on your own, start with our QuickStart guide to get free access. If you more support, just email us!
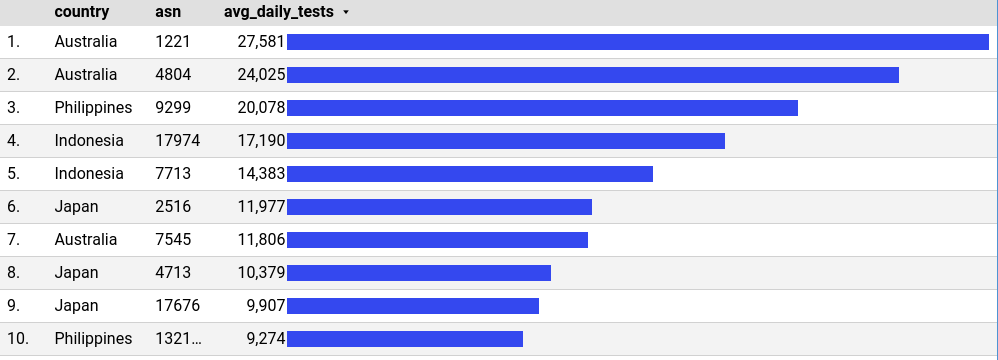
How many tests are run in APNIC economies?
The graph below shows the top ten ASNs from the APNIC region and the economies they are located in, ranked by number of average daily NDT tests.
What are the aggregate M-Lab measured download speeds in APNIC economies?
The table below shows the top ten ASNs from the APNIC region and the economies they are located in, ranked by median download of average daily NDT tests.
| wdt_ID | Economy | ASN | Min download | Lower quartile download | Median download | Upper quartile download | Max download |
|---|---|---|---|---|---|---|---|
| 1 | New Zealand | 4667 | 0.0303 | 23.9406 | 729.2297 | 830.4018 | 900.8779 |
| 2 | Japan | 10361 | 640.0982 | 640.0982 | 640.0982 | 640.0982 | 640.0982 |
| 3 | Singapore | 395753 | 600.7495 | 600.7495 | 600.7495 | 600.7495 | 600.7495 |
| 4 | Australia | 136405 | 568.8157 | 568.8157 | 568.8157 | 568.8157 | 568.8157 |
| 5 | Australia | 134245 | 254.0344 | 254.0344 | 552.8695 | 552.8695 | 552.8695 |
| 6 | New Zealand | 17542 | 518.3644 | 518.3644 | 518.3644 | 518.3644 | 518.3644 |
| 7 | Australia | 9792 | 95.0024 | 95.0024 | 491.8959 | 491.8959 | 491.8959 |
| 8 | Australia | 55486 | 480.0873 | 480.0873 | 480.0873 | 480.0873 | 480.0873 |
| 9 | Australia | 58696 | 1.1112 | 187.0406 | 471.7977 | 593.1795 | 780.2307 |
| 10 | Japan | 10012 | 310.8299 | 310.8299 | 457.4457 | 457.4457 | 457.4457 |
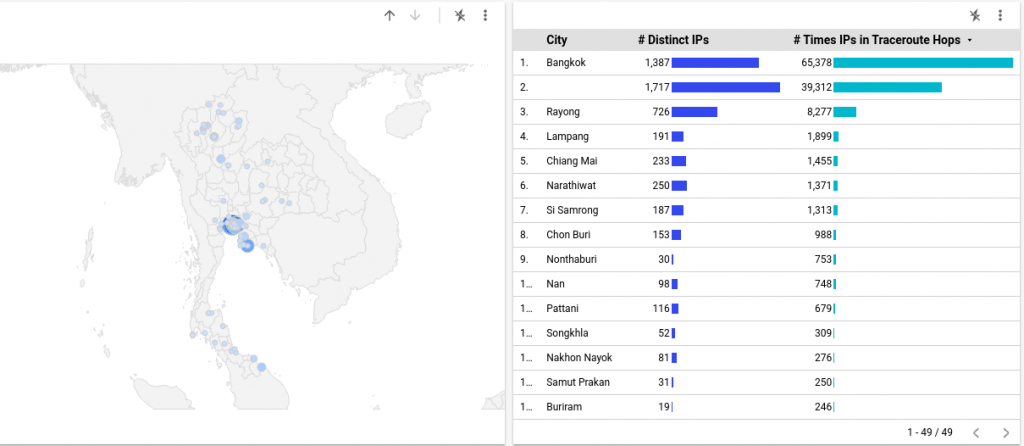
What are the common routes from M-Lab servers to client test IPs for my ASN?
Even for a query of traceroutes to 100 IP addresses, we still have a lot of data. But maybe we want to modify the query and simplify the results, grouping the most common IP addresses by geolocation, and then mapping the source and destination IPs. I’ve used Google Data Studio for this last chart, but you can also export the data and use it with other tools as well.
Assisting the research and IX communities
M-Lab’s focus on transparency, open-source tools, and public domain data enables widespread use by a diverse array of communities. A local example in the NGO sector is LIRNEasia: ‘a pro-poor, pro-market think tank’ that promotes decentralized innovation through competitive markets and other means.
In 2016, M-Lab partnered with LIRNEasia on their capacity building, research, and policy advocacy project in Myanmar, assisting with measuring mobile network speeds using a prototype Android application. Last year, LIRNEasia research fellow, Shazna Zuhyle, participated in a panel discussion on the State of Open Internet Issues Around the World (see video below) at the M-Lab 10th-anniversary summit.
We’ve also assisted journalists and bloggers with understanding M-Lab’s open data. Grace Mirandila-Santos writes on telecommunications issues for telecomasia.net, and in 2017 worked with M-Lab staff and Mr Wilson Chua, a big data analyst, to examine ISP peering in the Philippines. Their examination of M-Lab data demonstrated that networks which peered in-country performed better than those networks that did not.
One reason networks in the Philippines could peer in-country was the establishment of PHOpenIX, the only carrier-neutral Internet exchange in the Philippines. Operated by the Philippine government’s Advanced Science and Technology Institute in the Department of Science and Technology, PHOpenIX has hosted M-Lab measurement servers since 2015.
Getting involved
Sponsoring the hosting of M-Lab measurement servers is another way that larger organizations support our work. Aside from PHOpenIX, we’ve found other ‘core infrastructure partners’ in the APNIC region such as the Taiwan Academic Network (TANet) Information Center in Taipei, REANNZ in New Zealand; and one of our two server locations in Australia is hosted by AARNet.
M-Lab is always looking for new core infrastructure partners to broaden our server placements. See our server map.
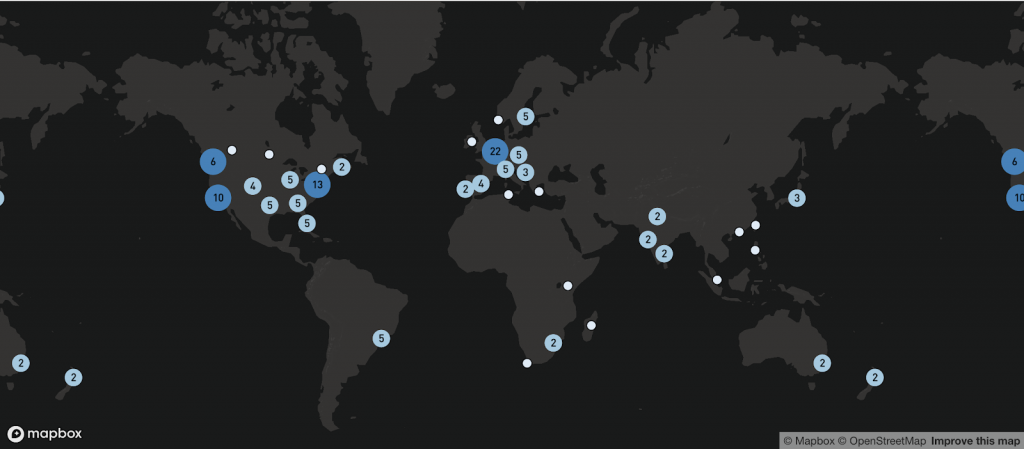
We’re currently working to expand our server presence in Hong Kong, India, and Japan, but we’re open to increasing our presence in other economies in the region as well. If you’re interested in partnering with us, please reach out.
We hope that these examples are a good introduction to M-Lab for network operators, and that our data might be useful for operational analyses, market research, or other business reasons.
Let us know what data or analyses you’re interested in learning more about in the comments section below.
Chris Ritzo is the Program Management and Community Lead for Measurement Lab, where he supports researchers, policy makers, advocacy groups, and individuals interested in M-Lab’s open Internet measurement data.
The views expressed by the authors of this blog are their own and do not necessarily reflect the views of APNIC. Please note a Code of Conduct applies to this blog.
Please send speed test analysis of Philippines ISP