

Last month, I participated in a Network Operator Tools Hackathon in Ireland, organized by the RIPE NCC and the Ireland Network Operators Group (iNOG). It was the last stop on my trip attending the recent LACNIC and RIPE NCC meetings, as well as working on a collaborative project at the RIPE NCC offices in Amsterdam.
The main reason for participating in this hackathon was to talk to participants and get ideas for the Routing Information Tools product I am working on to benefit network operators (see my presentation below at APRICOT 2018 for details on this project).
Coming up with a novel hackathon project
In the week before the hackathon, I was thinking of an appropriate project to work on, namely novel ways to use BGP data. I came up with the idea of measuring the dependence of an origin AS on transit ASes by counting the number of occurrences of each transit AS (in the set of AS paths for the origin AS being analyzed), and then visualizing these dependencies in a graph, displaying the nodes with a size proportional to the measured dependence.
I wrote a few paragraphs describing the idea, but in doing so realized the concept of dependence between ASes sounded familiar. I went back through my notes (sometimes I’m glad that I’m an obsessive note-taker!) and discovered that not only had I talked with Emile Aben at the RIPE NCC a few weeks before about work he was doing on AS interdependence, but I had also listened to his presentation about this topic during RIPE 76 in Marseille.
Emile has been working with Romain Fontugne (IIJ Reseach Lab) and Anant Shah (Colorado State University) on measuring AS interdependence using AS Hegemony — we even have a post on the APNIC Blog about it!
Read: AS hegemony: measuring AS interdependence
Not wanting to totally dismiss my idea, I contacted Emile to understand if it was worth computing the AS dependence using my approach and comparing it to theirs. After exchanging some emails and understanding the AS Hegemony approach a bit better, I realized my idea was quite naive: counting occurrences of transit ASes in the set of AS paths for a given origin AS in the end meant counting prefixes being propagated by those transit ASes. The interpretation of this count is not very meaningful, especially if a normalization is not done, as announced prefixes may be of different sizes.
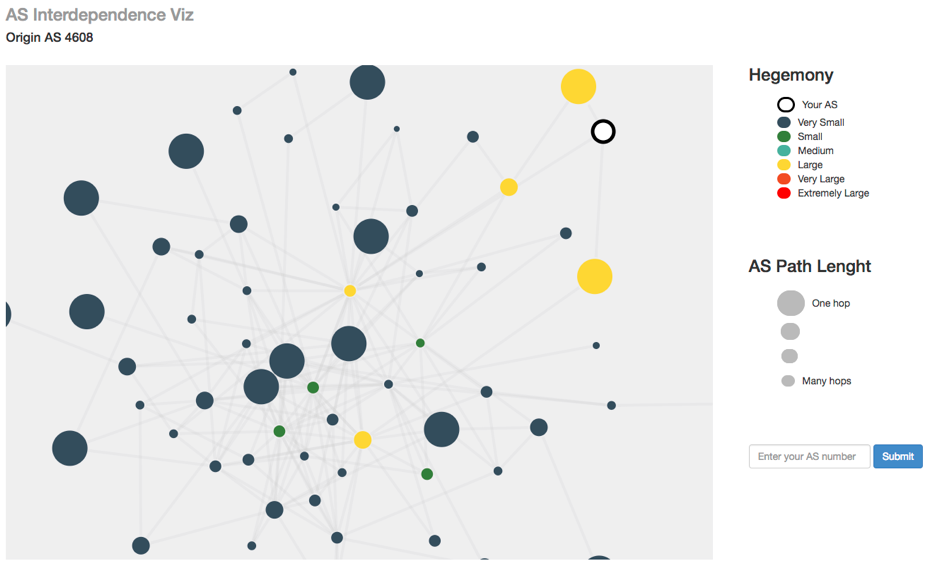 Figure 1 — Screenshot of the prototype of our AS interdependence visualization.
However, Emile thought there was something interesting in my idea: the visualization using a graph. Emile, Romain, and Anant are currently plotting historical values of the AS Hegemony of transit ASes that an origin AS is dependent on, and are making this public through the Internet Health Report — see this example for APNIC’s ASN. A graph visualizing the current state could make it easier for network operators to identify upstream providers (not just direct but also upstreams of their direct upstream providers) that their AS has a strong dependence on.
So, that’s what I proposed as an idea to work on during the hackathon, emphasizing that I needed someone with user interface (UI) expertise as I don’t know anything about front end development.
Time to get hacking
I was lucky enough to recruit two people who were interested in working with me: Iain Geddes (who has a networking background) and Pedro Vaz (RIPE NCC who has a UI background).
During the two-day hackathon — powered by stroopwaffles, ice cream and some healthier snacks — Iain and I worked mostly on the backend, processing raw BGP data, querying the AS Hegemony API and merging this data to generate a JSON file with all the information needed to draw the graph. Meanwhile, Pedro focused on finding a tool that could ingest a JSON file to create a pretty graph, with the attributes for the nodes that we wanted to show: the distance from the origin AS and the AS dependence measured by the AS Hegemony.
This is good hacking!! Thanks @cmsirbu and @Ms_Multicolor !! 🙂 pic.twitter.com/ouVwHfv38Q
— Sofía SilvaBerenguer (@SofiaSilvaB) June 24, 2018
We worked together to convert all this into a nice web page using Tiny Flask — a basic python3 flask webapp blueprint provided by Cristian Sirbu (iNOG); thanks Cristian! — which allowed us to easily add a web interface to our python scripts.
Cristian was one of the organizers of the hackathon and he was not the only one we interacted with. We also talked to Emile several times as we needed to understand better the data provided by the AS Hegemony API and how it was being computed. This led us to get a special mention at the end of the hackathon (and a box of stroopwaffles) for being the team that interacted the most with other people.
We won stroopwaffles!! It was a great weekend hacking 🙂 @inognet @RIPE_NCC #hackathon pic.twitter.com/zY9XuoM2jr
— Sofía SilvaBerenguer (@SofiaSilvaB) June 25, 2018
Challenges
The tool we chose for drawing the graphs didn’t work as expected in the beginning, which hindered Pedro from overriding some default values and setting specific sizes and colours for the different nodes. On the back end, the installation of the bgpdumpy library, which we needed to process the BGP data, was not as straight forward as expected.
We also had issues with the data — Emile explained that the AS Hegemony API doesn’t provide raw data for the computation of values and provides AS Hegemony values only if they are above a certain threshold.
A great weekend of hacking
We finally managed to solve these issues, build a prototype of our ‘AS Interdep Viz’ and present it at the end of the hackathon.
All in all, we had fun, we won stroopwaffles and we built a prototype illustrating we achieved our goals — a great weekend of hacking!
The views expressed by the authors of this blog are their own and do not necessarily reflect the views of APNIC. Please note a Code of Conduct applies to this blog.