
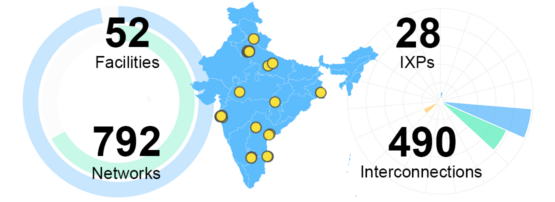
The IXP ecosystem in India has been growing substantially in recent years. While there are 28 IXPs in India, just two of them (DE-CIX Mumbai and Extreme-IX Mumbai) hold roughly 50% of the total provisioned capacity.
With India’s Internet user base expected to almost double between 2020 to 2025, I thought it would be interesting to see how this might change over time. As a result, I developed the Abater IX Dashboard.
What will the dashboard do?
The objective of the Abater IX Dashboard is to gather, store and display various statistics and activities related to the Indian IXP ecosystem, such as:
- Total capacity provisioned across all IXPs in India.
- The contribution of various CDN and ISP participants.
- The capacity distribution for any given network, across IXPs.
- When a network joins or leaves a new IXP.
- When an x-connect is upgraded or downgraded.
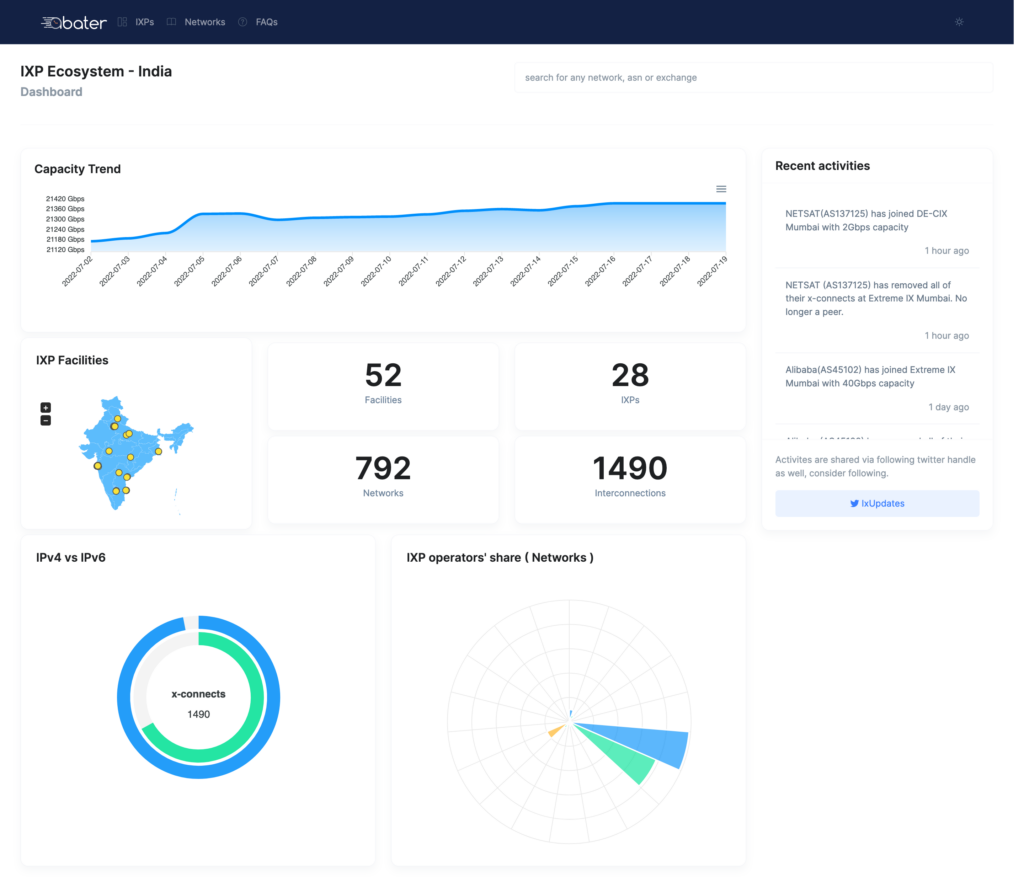
These changes are logged in the activity feed as well as shared via a twitter bot.
We’ve recorded 20 such activities between 8 to 13 July. Tracking these activities provides us with some interesting facts that otherwise would be very hard to get, such as when a network switches over from one IXP to another, as I tweeted here and here.
All statistics are based on the information sourced from the PeeringDB API, so they are as accurate and authentic as PeeringDB.
Future roadmap
I plan to add new statistics in the coming weeks, such as:
- Which IXP is preferred as their first IXP by network operators?
- Which network tweaks their IX connectivity more/less often.
I may also modify the codebase to make it a ‘multi-tenant’ project, so that similar dashboards for other economies can be built on the same platform.
Let me know in the comments below what other features and economies you’d be interested in having a similar dashboard for.
Rahul Makhija is a network engineer and web app developer who is either pushing bits or flipping bits, so is in-between bits all the time.
The views expressed by the authors of this blog are their own and do not necessarily reflect the views of APNIC. Please note a Code of Conduct applies to this blog.